Seeing Beyond the Peg: The Value of NCFX Crypto Data in Understanding Stablecoin Dynamics
- Oct 17, 2025
- 2 min read

Seeing Beyond the Peg: The Value of NCFX Crypto Data in Understanding Stablecoin Dynamics
The recent explosive growth of stablecoins has reshaped the digital asset landscape, offering traders and investors a bridge between traditional finance and the crypto economy. Yet, as the market has learned time and again, stability can be more complex than a price that appears “close to one.”
On the evening of 10th October (UK time), digital asset markets saw a sharp selloff across major tokens. As volatility spiked, many participants glanced quickly at USD Circle (USDC) and USD Tether (USDT) rates against the U.S. dollar. The quoted rates — showing values reassuringly close to 1.000 — appeared to confirm the resilience of these stablecoins. But was that really the whole story?
At New Change FX (NCFX), we know that a single quote rarely captures the complete picture. Our experience building high-quality, regulated benchmark rates — both in digital assets and fiat currencies — has taught us the importance of triangulation: using multiple, liquid trading routes to determine true market value.
When you apply this principle to USDC and USDT, a different — and far more revealing — narrative emerges.
Seeing Beneath the Surface
Chart 1 shows the sharp decline in BTC/USD as sell orders surged late Friday evening.
Chart 1: BTC/USD

On the other side of those trades were significant buy orders for USDC, as investors rotated into perceived safety.
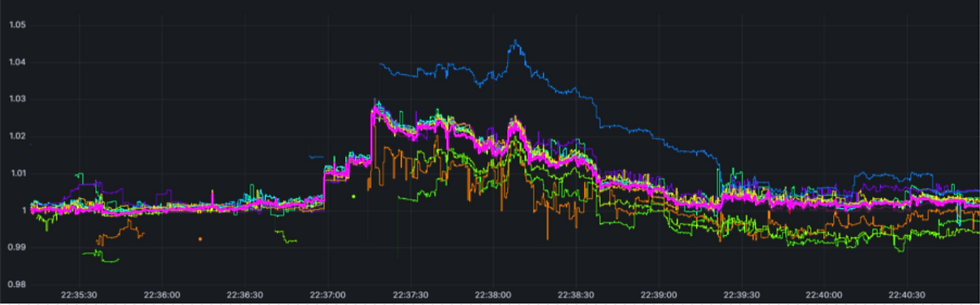
This activity had a measurable effect. When viewed through triangulated cross-rates, such as BTC/USDC versus BTC/USD, we observed that USDC’s effective value rose against the U.S. dollar. In other words, while direct quotes appeared stable, USDC’s real market purchasing power increased, as shown in Chart 2.
Chart 2: USDC measured through how many BTC it would buy compared to USD
The same dynamic appeared when analysing ETH pairs. Charts 3 and 4 illustrate how heavy buying in USDT led to measurable movements in its cross-rates through ETH, once again challenging the illusion of perfect stability.
Chart 3: USD/ETH

Chart 4: USDT measured through how many ETH it would buy compared to USD

A Broader Perspective on “Stable”
Charts 2 and 4 serve as powerful reminders: USDC and USDT are not the U.S. dollar — any more than the Hong Kong dollar is, despite its currency board peg. Each carries its own market risks, liquidity profile, and pricing behaviour that only become visible through comprehensive, multi-route data analysis.
This is where NCFX data adds unique value. Our benchmark rates:
Capture real, traded prices across multiple exchanges.
Apply transparent, regulated methodologies proven in the fiat markets.
Reveal hidden dynamics between digital tokens that single-source data misses.
For institutional traders, asset managers, and risk professionals, these insights are not just academic — they are critical for identifying opportunities, managing exposure, and understanding true market behaviour in an increasingly complex environment.
Conclusion
Stablecoins may aim for stability, but markets rarely stand still. By triangulating across liquidity routes and applying institutional-grade analytics, NCFX data uncovers the full story — turning raw crypto market noise into meaningful, actionable intelligence.


Comments